

Executive Summary
In today's rental housing market, risk is no longer a back-office function. It's one of the biggest, least-managed levers on NOI and asset value. Yet most institutional owners are still making risk decisions with fragmented, delayed, and incomplete data spread across dozens of systems.
Understanding What's Really at Stake
Before exploring the solution, it's worth grounding ourselves in what Total Cost of Risk (TCOR) actually means for multifamily operators. In our companion piece, Redefining Total Cost of Risk for Multifamily, we make the case that traditional TCOR definitions—focused narrowly on premiums, retained losses, and administration—miss a critical component: resident default risk. When you add unpaid rent, eviction costs, turn expenses, and collections drag to the equation, TCOR expands from a ~$640/unit insurance view to over $1,000/unit in many portfolios.
That expanded TCOR framework is the foundation for everything that follows here. A Risk Intelligence Hub exists precisely because managing this broader set of exposures requires unified data and coordinated action—not more spreadsheets.
Reality Check on Risk Costs
- Total Cost of Risk (TCOR) often consumes 5–10% of NOI, including premiums, deductibles, uninsured losses, resident defaults, and administration [1], [2].
- Insurance costs per multifamily unit have increased by more than 100% since 2018 in many portfolios, with national averages reported in the mid-$600s per unit annually [5], [8].
- In some markets, owners have seen property insurance premiums roughly double between 2021 and 2024 [6], while broader operating expenses continue to rise faster than historical norms [10].
A Risk Intelligence Hub changes that. It unifies your risk data, applies intelligence, and drives action back into your operating environment—turning risk management from overhead into a repeatable source of NOI growth and portfolio differentiation.
The Hidden Cost of Fragmented Risk Data
Most owners and operators can’t answer some fundamental—but costly—questions in real time:
- Which 10 properties are most likely to drive loss activity next year?
- How much NOI did we lose last quarter to resident defaults, fraud, and uninsured losses?
- Which programs and brokers are delivering the best risk-adjusted value, not just the lowest premium?
The reason is simple: critical risk information is trapped in silos across the organization.
- Policy & Insurance: Schedules, endorsements, and loss runs in broker portals and email threads
- Property Management: Incidents, tenant histories, and lease data in the PMS
- Maintenance & Ops: Work orders and asset condition data in separate systems
- Finance: Premiums, deductibles, uninsured loss, and reserves in the GL
- Legal & Compliance: Contracts, COIs, litigation, and settlements in shared drives
- External Risk Signals: Weather, crime, catastrophe models, and economic data in yet more tools
“You’re not just overpaying for insurance—you’re flying blind on where risk is being created, how it spreads through the portfolio, and how it erodes NOI.”
When risk data lives in isolation, you end up with:
- Reactive decisions instead of proactive control
- Pattern blindness—you see incidents, not trends
- Weak risk presentation to carriers and lenders
- Operational drag from manual reconciliations and duplicate entry
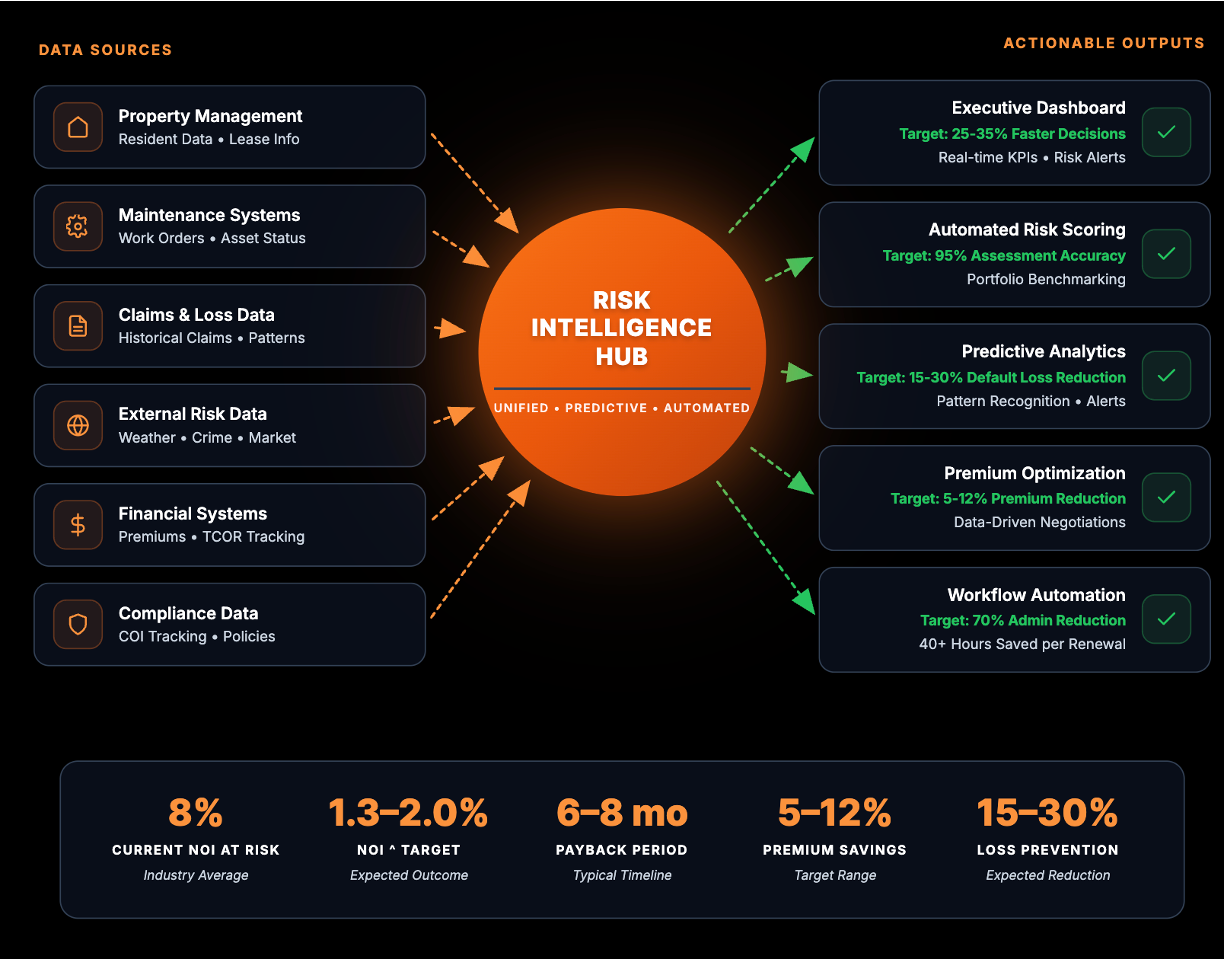
What Is a Risk Intelligence Hub?
A Risk Intelligence Hub is the command center for your risk ecosystem. It doesn’t replace your PMS, accounting platform, or broker tools—it connects, orchestrates, and augments them.
1. Data Integration Layer
Bring every risk-relevant signal into one place:
- API and file integrations with PMS, maintenance, finance, and claims systems
- Historical loss runs, incident histories, and resident default data
- Document intelligence for policies, endorsements, and COIs
- External feeds for weather, crime, catastrophe, and socio-economic indicators
Goal: No critical risk data lives only in someone’s inbox or a static spreadsheet.
2. Intelligence & Analytics Layer
Turn raw data into signals and foresight:
- AI/ML models predicting loss frequency and severity
- Property and portfolio-level risk scores with explainable drivers
- Fraud and resident default propensity across the tenant lifecycle
- Root-cause analytics for claims and operational incidents
- Climate and catastrophe overlays at the asset and building level
Goal: Move from “what happened?” to “what’s likely next—and what can we do now?”
3. Action & Workflow Layer
Push intelligence into everyday decisions:
- Role-based dashboards for executives, risk, ops, and regional teams
- Automated alerts, tasks, and playbooks tied to specific triggers
- Data-rich submission packages for brokers and carriers
- Embedded reporting for lenders, JV partners, and investment committees
Goal: Make the right risk action the default action—without relying on heroics.
The Business Case: From Overhead to Value Creation
A Risk Intelligence Hub pays off across three time horizons: immediate wins, strategic advantages, and long-term structural benefits.
Months 0–6: Immediate Wins You Can Feel
Faster, Smarter Incident Response
When a freeze, storm, wildfire, or civil unrest event hits, your Hub can instantly answer:
- Which properties are exposed, and to what hazards?
- What is the maintenance and loss history at those sites?
- Which prevention tasks have been completed—and which are overdue?
Operators with integrated data respond faster, reduce loss severity, and shorten recovery time, because they aren’t hunting for information during the event.
Less Manual Administration, More Strategic Work
A Hub eliminates “spreadsheet-of-record” risk management:
- Automatic ingestion of policy schedules, COIs, and loss runs
- System-driven workflows between carriers, brokers, and site teams
- One source of truth instead of multiple conflicting files
Assurified’s InsurOps approach targets substantial reductions in manual administration through automated workflow between carriers, brokers, and property teams [3].
Higher COI Compliance and Less “Silent” Risk
Automated COI tracking and workflows:
- Surface missing and expiring COIs in time to act
- Compare coverage limits and endorsements against your standards
- Escalate to operations before a loss occurs
The result is fewer uninsured vendor exposures and a stronger footing when you need to defend a claim.
Months 6–12: Strategic Advantages That Compound
Premium Optimization, Not Just Premium Shopping
With a Risk Intelligence Hub, you walk into renewals with:
- Clean, credible exposure and loss data
- Evidence of operational improvements and risk controls
- Benchmarking across regions, assets, and programs
Assurified’s InsurOps platform targets 5–10% premium savings through AI-assisted negotiation and improved risk presentation [4]. Even a 3–5% improvement in insurance efficiency on a large portfolio translates into meaningful, recurring NOI impact.
Systematic Loss Reduction
Predictive analytics uncover:
- Water intrusion patterns and chronic building issues
- Slip-and-fall hotspots and lighting/security blind spots
- Asset types and vintages with outsized loss ratios
In an environment where average multifamily insurance costs have risen to the mid-$600s per unit nationally and climbed roughly 120–130% since 2018 [5], [8], proactively addressing these patterns helps offset continued pricing pressure by reducing claims.
Better, Faster Capital Decisions
Risk intelligence informs:
- Hold/sell decisions based on risk-adjusted NOI
- Refinancing strategies for high-variance assets
- CapEx allocations toward resilience and remediation
- Investor updates that quantify risk posture, not just describe it
This becomes especially important as property insurance remains volatile, with some owners reporting premiums in 2024 that are roughly double their 2021 levels [6].
Year 1 and Beyond: Structural Advantage
Sustained NOI Uplift and Portfolio Differentiation
Once risk is managed as a system:
- TCOR as a percentage of NOI can be bent downward and controlled
- Loss volatility is reduced, improving cash flow predictability
- Operating margins become more resilient to rate and expense shocks
Case studies in property management have shown NOI improvements of around 12% in the first year through systematic operational enhancements [7]. While results vary by portfolio, integrated risk management is a key contributor to this uplift. In an industry where risk-related costs can consume 5–10% of NOI [1], [2], portfolios demonstrating systematic control over these costs stand out to investors.
How to Implement a Risk Intelligence Hub (Without Boiling the Ocean)
The most successful operators follow a pragmatic, three-phase roadmap that delivers value early and often.
Phase 1 (Months 0–3)
Foundation
Objective: Connect and see.
- Inventory systems and risk-relevant data sources
- Stand up core integrations (PMS, insurance, finance, COIs)
- Launch first dashboards (TCOR by region, property, and line)
- Automate COI tracking and basic alerts
Outcome: A trusted risk data layer and visible quick wins that build executive momentum.
Phase 2 (Months 4–6)
Intelligence
Objective: Predict and prioritize.
- Implement risk scoring at the property and portfolio levels
- Deploy models for loss, incident, fraud, and default propensity
- Launch targeted loss-prevention playbooks (e.g., water, slips/falls, security)
- Use Hub insights in broker and carrier conversations
Outcome: A repeatable way to prioritize actions and dollars where they have the most significant TCOR impact.
Phase 3 (Months 7–12)
Optimization
Objective: Automate and embed.
- Expand AI/ML models and benchmarking across assets and programs
- Simulate retention options and risk transfer strategies
- Embed risk insights into budgeting, CapEx planning, and asset strategy
- Standardize reporting for investors, lenders, and boards
Outcome: Risk intelligence becomes part of how you operate the business, not a parallel reporting function.
The Leadership Imperative
Building a Risk Intelligence Hub is not an IT project. It’s a strategic operating model shift that requires:
- Executive sponsorship to position the Hub alongside revenue management and asset management
- Cross-functional collaboration across risk, operations, finance, asset management, and technology
- Data governance and standards for risk, incident, and default data from site teams to corporate
- Change management and enablement so teams know how to act on insights, not just view dashboards
The Market Reality: Why Now
Even as some property insurance markets show signs of stabilizing, multifamily is operating from a structurally higher risk-cost baseline than it was just a few years ago. Premiums, deductibles, and non-insured exposure have all shifted upward [5], [6], [8].
Industry sources also highlight:
- Property insurance is experiencing particularly acute pressure in catastrophe-exposed markets [8]
- Liability renewals frequently averaging 10–20% increases due to litigation trends [9]
- Operating expenses are rising sharply year-over-year, with insurance among the fastest-growing line items [10]
Doing nothing is a decision—to absorb whatever the market throws at you. A Risk Intelligence Hub is the alternative: a way to take control of your risk curve rather than letting it control you.
From Risk Overhead to Strategic Advantage
In an environment where risk-related costs consume a meaningful share of NOI, organizations that harness risk intelligence systematically will enjoy more resilient cash flows, stronger valuations, and a clear edge with capital partners.
Next Steps: Turning Vision into Measurable Value
- Benchmark Your TCOR
- Quantify your current risk spend as a share of NOI (premiums, deductibles, uninsured loss, default, admin).
- Map Your Data Silos
- Inventory systems, spreadsheets, and external feeds touching risk decisions.
- Define Success Metrics
- Example: 3–5% premium efficiency, 10–20% reduction in manual risk administration, measurable reduction in loss frequency on top quartile risk properties.
- Pilot a Risk Intelligence Hub
- Start with a sub-portfolio or region to prove out value and refine playbooks.
- Scale Across the Enterprise
- Embed risk intelligence into budgeting, CapEx, program design, and investor reporting.
References
- Assurified Press Release, “Assurified Advances Risk Transformation Platform Ahead of OPTECH 2025,” November 2025. Reports that TCOR “can consume 5 to 10% of net operating income (NOI)” depending on market and other factors.
- Based on Assurified TCOR framework showing Expanded TCOR of $1,080/unit (~8% of NOI) for institutional multifamily, including insurance premiums ($714/unit), risk retention ($89/unit), administrative costs ($49/unit), and resident default costs ($228/unit). Source: NMHC survey data and Assurified analysis.
- Assurified InsurOps solution targets “up to 70% less manual administration” through automated workflow between carriers, brokers, and property teams. Source: Assurified Press Release, November 2025.
- Assurified InsurOps platform targets “5–10% premium savings” through AI-assisted negotiation and carrier benchmarking, enabled by integrated data and improved risk presentation. Source: Assurified solution materials.
- Yardi Matrix Property Insurance Expense Bulletin, March 2024. Reports that property insurance costs rose to approximately $636 per unit nationally as of January 2024, up about 129% since 2018. Source: “Insurance costs lead the rise in multifamily expenses,” Yield PRO, April 2024.
- Federal Reserve Bank of Minneapolis, “Rising property insurance costs stress multifamily housing,” 2025. Survey of 35 owners operating nearly 45,000 units found that property insurance premiums in 2024 were roughly double those of 2021.
- BFPM Inc. case study reporting that full-service property management helped property owners boost NOI by an average of 12% in the first year through optimized rent pricing, expense audits, resident retention initiatives, and reduced turnover. Source: “How Full-Service Property Management Increases NOI in Los Angeles Multifamily Assets,” BFPM, August 2025.
- RealPage data shows average multifamily insurance costs increased from approximately $30 per unit per month pre-pandemic to $65 per unit per month by November 2023, representing a roughly 119% increase. In high-risk markets like West Palm Beach, annual costs exceeded $1,800 per unit. Source: “Rising Multifamily Insurance Costs in 2025: What Owners Need to Know,” Matthews Real Estate Investment Services, March 2025.
- NMHC 2024 State of Multifamily Risk Report notes liability renewals frequently averaging 10–20% increases, with many owners experiencing higher rates due to litigation trends. Cited in Assurified Press Release, November 2025.
- GlobeSt reporting shows operating expenses rose about 28% year-over-year as of February 2024, with insurance expenses surging by more than 10% compared to 2022. Source: “Ways to Maximize NOI For Your Multifamily Investment,” Matthews Real Estate Investment Services.