

Redefining Total Cost of Risk (TCOR) in Multifamily
A comprehensive guide for institutional rental housing risk & finance leaders navigating today's unforgiving insurance landscape — and why resident default risk belongs inside the TCOR conversation.
Executive Summary & Author’s Note
When I first published this analysis of Total Cost of Risk (TCOR) for rental housing, the focus was on unifying insurance premiums, retained losses, risk-control investments, and administrative overhead into a single metric risk and finance leaders could use to guide portfolio decisions. That framework drew on established definitions of TCOR from industry sources such as APTA and other risk management literature, which concentrate on insurable risk categories like property, liability, and workers’ compensation.[3], [4]
Those traditional TCOR frameworks were developed primarily for corporate and commercial settings, where rent delinquency is not a core exposure. As a result, resident default risk is generally not included in formal TCOR calculations. In the context of multifamily and rental housing, however, resident delinquency and default have clear and recurring financial impacts that are documented across multiple sources—including rent payment tracking, eviction cost studies, and housing research.[1], [2], [9]–[15]
These materials show that rent nonpayment, legal processes, move-out and turn costs, and collections outcomes create meaningful financial drag that is measurable over time and across portfolios. In multifamily, resident default shows measurable patterns in frequency, severity, and operational impact (as documented in eviction cost research, lender credit analyses, and delinquency data), giving it characteristics that are similar to other risk exposures rather than functioning purely as a routine operating expense.[1], [2], [11]–[15]
This revised edition of the article updates the TCOR lens to reflect that reality. It proposes an expanded definition of TCOR for rental housing that adds the full lifecycle cost of resident default—unpaid rent and fees, utilities, legal and court costs, turn and make-ready, concessions, collections, and uncollected bad debt—to the more familiar components of property and liability risk.
Importantly, the underlying structure of the original piece remains intact. The premium, geographic, and illustrative TCOR uplift examples are unchanged and continue to reference widely cited industry sources for pricing trends, per-unit costs, and capitalization-rate math.[1], [5], [6], [8] What this revision does is extend the framework so that resident default is treated as part of the same conversation, rather than as an unrelated collections or operating issue.
The result is a TCOR model that is better aligned with how financial exposures actually manifest in modern rental housing operations. It allows risk and finance leaders to evaluate initiatives that reduce default-related losses—such as fraud controls, screening, early intervention, and turn-time improvements—inside the same value-creation engine they use for premiums, retention, and loss prevention on the property side. The quantitative examples in the sections that follow remain illustrative in nature and are intended to show the logic and mechanics of this expanded TCOR view, not to represent a specific portfolio or empirical result.
In short, the original article argued that TCOR is an underused lever for NOI and asset performance in multifamily. This revision keeps that conclusion, but broadens the scope: once resident default is incorporated into TCOR, the potential impact of disciplined risk management on NOI and asset value becomes both more comprehensive and more transparent.
Executive Context: The Perfect Storm
Risk executives in rental housing are navigating a convergence of pressures: insurance premium increases since the early 2020s, carrier retrenchment in catastrophe-exposed regions, data fragmentation across legacy systems, evolving regulatory requirements, and persistent resident delinquencies and skips. Industry surveys and regional analyses suggest that many of these pressures reflect structural shifts in how risk is priced and capital is allocated, rather than short-term anomalies.[1], [2]
- Property insurance costs remain elevated relative to the late 2010s, with some markets seeing moderation from prior peak increases.[1], [5]
- Liability programs continue to reflect concerns about litigation trends and “social inflation” in several lines of business.[1]
- Capacity constraints are particularly notable in hurricane- and wildfire-exposed states, influencing pricing and terms.[2], [8]
- Higher reinsurance costs and changing risk appetites contribute to more selective underwriting in parts of the market.[1], [8]
From Expense to Investment: The TCOR Framework
In most corporate risk management frameworks, TCOR is defined as the sum of insurance premiums, retained losses (such as deductibles and self-insured layers), risk control investments, and administrative overhead.[3], [4] In these models, resident default losses do not appear as a TCOR component; they are typically reflected elsewhere in financial statements.
That structure may be appropriate for many corporate portfolios. In rental housing, however, resident default has several characteristics associated with risk exposures: it produces measurable financial impacts over time, shows patterns linked to asset type and market conditions, and is influenced by policy choices, operations, and screening practices documented in industry and academic research.[1], [2], [9]–[15]
Reframing TCOR for rental housing therefore means consolidating both traditional insurance costs and the full lifecycle cost of resident default into a single metric that can be managed, optimized, and communicated to investors.
- Property, general liability, and umbrella premiums
- Retained losses (deductibles, self-insured layers, uninsured perils)
- Loss-prevention and risk-control investments
- Risk administration and brokerage/TPA fees
- Resident default lifecycle costs: unpaid rent and fees, utility pass-throughs, fraud write-offs, skips and lease breaks, eviction and legal costs, make-ready and damage, concessions, collections expense, and uncollected bad debt
For a portfolio where TCOR reductions translate directly to NOI, a 10% improvement in TCOR would mathematically imply:
- NOI uplift on the order of $64–$80 per unit annually (using the example above)
- Asset value creation of roughly $1,280–$1,600 per unit at a 5% cap rate[6]
- A 100-unit portfolio: approximately $128,000–$160,000 in illustrative value impact
- A 1,000-unit portfolio: approximately $1.28M–$1.6M in illustrative value impact
Geographic Realities: Where Risk Bites Hardest
Premium levels and volatility vary significantly by geography. While national per-unit averages provide a helpful benchmark, properties in coastal and catastrophe-exposed markets frequently encounter materially higher insurance costs than comparable assets in less exposed regions, as reflected in lender commentary and insurance expense reports.[2], [5], [8]
- Hurricane and coastal zones: frequently show substantially higher per-unit insurance costs than inland markets.
- Wildfire-exposed regions: often experience pricing and terms that reflect evolving views of climate and concentration risk.
- Midwest/Mountain West: in many cases, exhibit insurance costs closer to or moderately above national averages.
- Portfolio diversification: geographic spread across risk regimes is an important consideration in TCOR management.[2], [5], [8]
Market Dynamics You Can't Ignore
Recent years have brought sustained increases in property insurance rates for many multifamily owners, followed by indications in some segments that the pace of those increases may be moderating. At the same time, concerns about liability, litigation, and exclusions continue to influence program design and pricing.[1], [5]
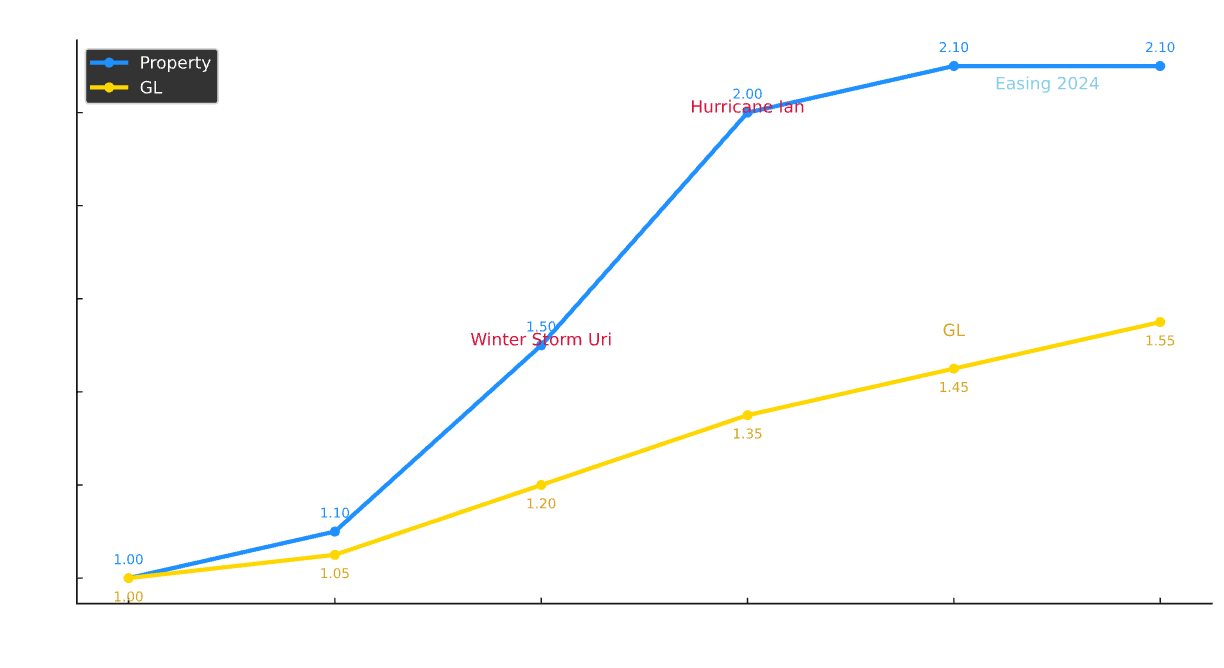
- Previous periods of double-digit rate increases have, in some markets, given way to more moderate changes or selective stabilization.
- Capacity has begun to return in certain non-catastrophe regions, while remaining constrained in others.[1], [8]
- Higher deductibles and more restrictive terms remain common negotiating points.
- Liability programs are influenced by concerns about claim severity and litigation trends in various jurisdictions.
- Large verdicts and settlements, where they occur, can have an outsized effect on pricing and risk appetite.
- Coverage limitations and exclusions, including assault and battery in some programs, are important to monitor as part of overall TCOR.[1]
Resident Default Risk: The Missing TCOR Line Item
In standard TCOR practice, resident default risk is usually treated as an operating matter—captured under bad debt, legal costs, turnover expense, or miscellaneous write-offs—rather than as a defined risk category. In rental housing, this convention can obscure a distinct source of financial variability that is closely tied to rent payments, household resilience, legal processes, and property operations.[9]–[15]
Even in well-run portfolios, resident default—driven by fraud, skips, lease breaks, chronic delinquency, and post-move-out bad debt—can represent a meaningful share of financial drag. Because these losses are dispersed across financial, legal, and operational line items, they rarely appear in a unified risk dashboard and are often discussed separately from insurance and retained losses.
- Unpaid rent, utilities, amenity and ancillary fees
- Eviction filing, legal counsel, and court or sheriff/constable costs
- Extended vacancy during legal process and re-leasing
- Turn costs: repairs, cleaning, painting, and damage remediation
- Collections agency fees, charge-offs, and discounted recoveries
- Staff time across site, regional, legal, and accounting teams
For portfolios with average rents in the mid- to upper-range and non-trivial levels of delinquency, internal analysis frequently shows that fully loaded default costs can represent a meaningful share of effective gross revenue. In some cases, these costs can exceed what appears in a single “bad debt” line item, once legal, turn, and administrative components are incorporated.[9]–[15]
While TCOR frameworks have historically focused on property and liability, several characteristics suggest that resident default can be treated analytically as a risk-type exposure in multifamily:
- It is statistically measurable: default frequency and severity can be tracked over time and analyzed by asset type, market, and resident profile.[9]–[13]
- It is influenced by operational and policy choices, including screening quality, fraud detection, communication practices, and payment support tools.
- In some contexts, it can be partially transferred or financed through structured arrangements designed to support rent payment or to share default risk.[11], [14]
- It has a clear economic “premium equivalent”: operators are already “paying” for default in the form of bad debt, legal cost, and turn expense; integrating those amounts into TCOR aligns the measurement with how value is actually affected.
Quantifying Resident Default into TCOR
To bring resident default into a TCOR framework, operators can use an approach that parallels traditional loss analysis:
- Aggregate the fully loaded cost of resident default (lost rent and fees, utilities, turn, legal, collections, and internal time) for the last 3–5 years.
- Normalize those costs on a per-occupied-unit and percentage of effective gross revenue basis, by market and asset class.
- Consider what portion of that cost could be:
- reduced through screening, fraud controls, engagement, and process improvements; and
- transferred or financed via structured arrangements that an operator judges economically acceptable.
- Incorporate the resulting resident default metrics into TCOR dashboards and board reporting alongside premiums and retained losses.
Once resident default is brought into the TCOR framework in this way, it typically emerges as one of the more visible levers for improving the stability and predictability of NOI, especially in portfolios where delinquency and turnover pressures are material.
Operational Inefficiencies: The Hidden Drain
Many rental housing organizations encounter similar challenges when pulling together the information needed for risk decisions: data relevant to claims, exposures, resident behavior, and collections is spread across multiple systems; renewal documentation requires substantial manual effort; and limited integration makes it harder to see patterns across insurance and resident default experience.
Current State: Fragmentation
Future State: Integration
- Time savings: moving from heavily manual renewals toward more automated data aggregation can free up meaningful hours for analysis and strategy.
- Loss prevention: combining claims, exposure, maintenance, and resident default data makes it easier to identify patterns that support targeted prevention efforts.
- Premium impact: better data can support more nuanced negotiations and retention choices with carriers and advisors.[3], [4]
- Retention optimization: aligning deductible and retention decisions with multi-year loss and default experience can improve capital efficiency, particularly when property and resident default data are viewed together.
Board-Ready Metrics: Speaking the Language of Value
Risk executives are increasingly expected to explain complex risk dynamics in terms that boards and investors can connect to capital allocation and NOI. In multifamily, that conversation naturally spans property risk, liability, and—when TCOR is expanded—resident default and collections experience.
- PML/TIV Ratio: Probable Maximum Loss as a percentage of Total Insured Value for catastrophe scenarios.
- TCOR Variance: Actual vs. budgeted TCOR, with attribution by geography, line of business, and (when included) resident default.
- Loss Development: trends in reported versus ultimate losses, including any relevant IBNR considerations.
- ESG Integration: risk scores and practices aligned with environmental and social frameworks.
- Resident Default KPIs: default loss per move-in, patterns in fraud, eviction frequency, recovery rates, and the split between retained versus structured or financed default-like costs.[9]–[15]
- Capital Efficiency: risk-adjusted returns on retention, financing, and risk-transfer decisions across both property and resident default exposures.
Strategic Approaches: Premium-Only vs Comprehensive TCOR
The gap between traditional premium management and comprehensive TCOR optimization isn't incremental—it's transformational. Nowhere is this more visible than in how portfolios manage resident default risk.
Premium-Only Strategy
- Renewal activity concentrated in a relatively short window each year
- Primary focus on rate and terms at point of renewal
- Limited carrier options in constrained markets
- Reactive posture toward losses
- Coverage decisions made with partial data
- Resident default treated as “bad debt” in the operating budget rather than as part of risk analytics
Comprehensive TCOR Strategy
- Year-round engagement with market conditions and scenario planning
- Loss-prevention programs for both physical perils and resident behavior
- Data-driven retention, limit, and deductible decisions by line and layer
- Use of analytics to anticipate loss patterns and inform structured program design
- Consideration of alternative risk transfer and captive structures where appropriate
- Explicit inclusion of resident default costs in TCOR to turn volatile bad debt into a managed risk category
- Board-grade reporting and KPIs tying risk decisions back to NOI
- Misses 60–70% of TCOR components
- No leverage from structured loss prevention
- Suboptimal retention decisions
- Weak negotiating position with carriers
- Resident default viewed as a “collections problem” rather than a blend of preventable and financeable risk
- 15–30% lower loss frequency (where prevention programs are executed well)
- 20–40% reduction in admin costs via better data and workflows
- 5–12% better premium outcomes from stronger positioning
- $100–300k annual retention savings at scale
- Meaningful reductions in default-related losses when operational changes and risk structures are aligned
Your 90-Day TCOR Transformation Roadmap
The path from insurance expense to NOI-oriented TCOR discipline is not hypothetical—many of the steps required are already familiar to risk and finance teams. The key change is to treat resident default as part of the TCOR equation, rather than as an isolated collections issue.
- Week 1–2: Calculate Your True TCOR
Pull premiums, deductibles paid, TPA fees, broker fees, internal admin time, and safety costs. Then add a full resident default view: unpaid rent and fees, utilities, eviction and legal costs, turn, concessions, collections expense, and uncollected bad debt. Compare an “insurance-only” view (e.g., property premiums per unit) with your blended figure that includes default-related costs.
- Week 3–4: Audit Your Data Landscape
Map where loss data, exposure schedules, maintenance records, AR and bad debt reports, and financial metrics currently live. Document gaps, redundancies, and manual processes—especially across leasing, accounting, and legal workflows tied to resident default and collections.
- Week 5–8: Build Your Integration & Coverage Business Case
Model the NOI impact of several TCOR scenarios (for example, 5%, 10%, and 15% reductions) for your portfolio, explicitly breaking out:
- Premium and retained loss changes from better data and market positioning.
- Resident default cost changes from screening, fraud detection, and payment support.
- Potential structured approaches to financing or sharing a portion of default-related costs, where suitable.
Use your prevailing cap rate assumptions to translate these scenarios into indicative asset value impacts for board and investor discussions.[6]
- Week 9–10: Launch Prevention & Default-Focused Pilots
Select a small set of properties for targeted pilots based on both claims and resident default patterns. Combine physical risk prevention (e.g., water or slip/fall) with improvements in resident engagement, fraud controls, and payment pathways. Track metrics such as loss frequency, time-to-possession, recovery rates, and turn times.
- Week 11–12: Optimize Retention & Default Program Strategy
Review 5-year loss history and default data to test alternative deductible and retention structures. Where appropriate, evaluate whether any structured arrangements could improve the balance between retained and transferred risk for both property and resident default-like exposures.
- Ongoing: Establish Quarterly TCOR & Default Reviews
Create recurring dashboards showing TCOR trends, resident default KPIs, prevention initiatives, and market conditions. Treat resident default as a standing component of the TCOR discussion, rather than a temporary post-pandemic anomaly or a separate collections issue.
The Human Factor: Leadership Under Pressure
Behind every TCOR initiative is a leadership team balancing multiple demands. Risk executives in rental housing are managing expectations for cost discipline while premiums have been volatile, working to protect residents and assets while carriers refine terms, and modernizing systems while operating with lean teams. Increasingly, they are also being asked to address the volatility of resident default without undermining renter affordability or brand reputation.
- Building coalitions: bringing operations, finance, asset management, and receivables together around TCOR metrics that include resident default.
- Speaking the language of value: translating both insurance and default-related complexity into NOI and asset value terms for boards and investors.
- Investing in prevention: piloting safety, fraud, and default-prevention initiatives with clear measurement plans before scaling.
- Leveraging data: shifting from anecdote-driven conversations to analytics-based narratives that integrate claims, operations, and resident default.[1]–[2], [9]–[15]
- Managing up and down: providing clarity to boards on strategy while ensuring that property and central AR teams see how their work connects to TCOR outcomes.
References
- National Multifamily Housing Council (NMHC). State of Multifamily Risk Survey & Report. 2024.
- Federal Reserve Bank of Minneapolis. “Rising property insurance costs stress multifamily housing.” March 4, 2025.
- APTA. Total Cost of Risk (TCOR) Overview. December 2023.
- The Baldwin Group. “Understanding Total Cost of Risk.” July 17, 2025.
- Yardi Matrix. Property Insurance Expense Bulletin. March 2024.
- Freddie Mac. Capitalization Rate Guidance. (Value = NOI ÷ Cap Rate.)
- Apartment List. National Rent Report. Current series.
- Fannie Mae. Multifamily Economic & Market Commentary. May 2024.
- Assurified. “Underwriting Bad Debt Revisited: The True Cost of Tenant Default.” 2024.
- Assurified. “Protecting NOI: Managing the Resident Default Risk Lifecycle in Rental Housing.” 2025.
- Investopedia. “Rent Guarantee Insurance: Protecting Rental Income.” 2025.
- Innovation for Justice and related legal research initiatives on the cost of eviction, including the Cost of Eviction Calculator and national eviction cost studies.
- National and regional housing policy and legal aid organizations publishing research on eviction, collections, and rent delinquency.
- Propmodo and other industry publications discussing landlord risk-financing and tenant default as an insurable-type exposure.
- Industry eviction cost studies and landlord association data on fully loaded eviction and default-related costs.
Notes: Visuals are schematic and scaled to the cited figures where applicable. All numeric examples are illustrative and should be calibrated to portfolio-specific experience and actual results.