
Total Cost of Risk (TCOR) in Multifamily
A comprehensive guide for institutional rental housing risk & finance leaders navigating today's unforgiving insurance landscape
Executive Context: The Perfect Storm
Risk executives in rental housing face an unprecedented convergence of challenges: insurance premium shocks that have doubled costs since 2021, shrinking carrier capacity in CAT-exposed regions, data fragmentation across legacy systems, and escalating regulatory complexity. These pressures aren't temporary—they're structural shifts reshaping how sophisticated operators must approach risk.
- Property rates showing first signs of easing in 2024 after 7-year climb
- GL liability continues upward pressure at 2–8% annually due to social inflation
- Capacity exodus accelerating in Florida, Texas Gulf Coast, and California wildfire zones
- Reinsurance costs up 30-50% driving primary carrier conservatism
From Expense to Investment: The TCOR Framework
Total Cost of Risk (TCOR) reframes insurance from a grudge purchase into an operating discipline. By consolidating premiums, retained losses, risk control investments, and administrative overhead into a single metric, sophisticated operators gain decision-quality visibility into where actions translate directly into NOI enhancement.
At 10% TCOR improvement:
- NOI uplift: $64–$80 per unit annually
- Asset value creation: $1,280–$1,600 per unit (5% cap)
- 100-unit portfolio: $128,000–$160,000 total value
- 1,000-unit portfolio: $1.28M–$1.6M total value
Geographic Realities: Where Risk Bites Hardest
Premium disparities across U.S. metros create dramatically different operating realities. While the national average hovers around $640 per unit, CAT-exposed markets face costs 2.5x higher, fundamentally altering asset economics and investment strategies.
- Hurricane zones: 150-265% above national average
- Wildfire regions: 80-120% above average
- Midwest/Mountain West: 20-40% above average
- Portfolio diversification: Critical for TCOR management
Market Dynamics You Can't Ignore
After seven years of relentless increases, property rates finally showed signs of moderation in 2024. However, this relief is partial and unevenly distributed. General liability continues its upward march, driven by social inflation and nuclear verdicts that show no signs of abating.
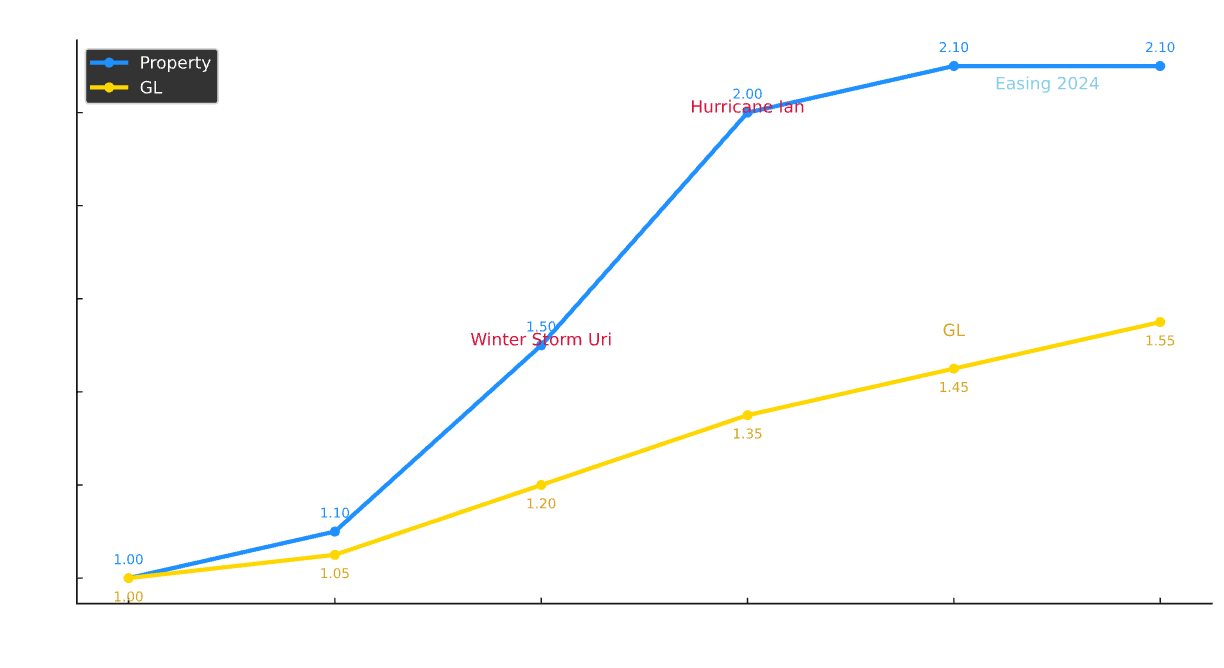
- Rate increases moderating: 5-10% vs 15-25% prior years
- Capacity returning selectively to non-CAT regions
- Deductibles still rising: $25k-$100k becoming standard
- Social inflation driving 7-10% annual increases
- Nuclear verdicts ($10M+) up 235% since 2014
- Assault & battery exclusions becoming standard
Operational Inefficiencies: The Hidden Drain
Research across the rental housing industry reveals consistent patterns: fragmented data across 5-7 systems, manual documentation consuming 40+ hours per renewal, compressed timelines leaving no room for strategy, and limited predictive capabilities that turn every claim into a surprise.
Current State: Fragmentation
Future State: Integration
- Time savings: 87% reduction in renewal preparation (40hrs → 5hrs)
- Loss prevention: 15-30% reduction in frequency through pattern detection
- Premium impact: 5-12% better outcomes with data-backed negotiations
- Retention optimization: $50-200k annual savings on deductible strategy
Board-Ready Metrics: Speaking the Language of Value
Today's sophisticated risk executives are no longer just insurance buyers—they're strategic operators who need to communicate complex risk dynamics to boards and investors.
- PML/TIV Ratio: Probable Maximum Loss as % of Total Insured Value
- TCOR Variance: Actual vs budget with clear attribution
- Loss Development: IBNR reserves and tail exposure
- ESG Integration: Risk scores tied to sustainability frameworks
- Capital Efficiency: Risk-adjusted returns on retention decisions
Strategic Approaches: Premium-Only vs Comprehensive TCOR
The gap between traditional premium management and comprehensive TCOR optimization isn't incremental—it's transformational.
Premium-Only Strategy
- Annual renewal scramble (60-90 days)
- Rate negotiation focus
- Limited carrier options
- Reactive to losses
- Basic coverage decisions
- Minimal data utilization
Comprehensive TCOR Strategy
- Year-round market engagement
- Loss prevention programs
- Data-driven retention optimization
- Predictive analytics deployment
- Alternative risk transfer exploration
- Board-grade reporting & KPIs
- Misses 60-70% of TCOR components
- No leverage from loss prevention
- Suboptimal retention decisions
- Weak negotiating position
- 15-30% lower loss frequency
- 20-40% reduction in admin costs
- 5-12% better premium outcomes
- $100-300k annual retention savings
Your 90-Day TCOR Transformation Roadmap
The path from insurance expense to NOI driver isn't theoretical—it's a proven playbook that leading portfolios are executing today.
- Week 1-2: Calculate Your True TCOR
Pull premiums, deductibles paid, TPA fees, broker fees, internal admin time, and safety costs. Benchmark against the $640/unit national average and your specific markets.
- Week 3-4: Audit Your Data Landscape
Map where loss data, exposure schedules, maintenance records, and financial metrics currently live. Document the gaps, redundancies, and manual processes.
- Week 5-8: Build Your Integration Business Case
Model the NOI impact of 5%, 10%, and 15% TCOR reduction for your portfolio. At typical cap rates, show the asset value creation.
- Week 9-10: Launch Prevention Pilots
Select 2-3 properties for targeted loss prevention based on claims patterns. Focus on slip/fall reduction, water damage prevention, or security upgrades.
- Week 11-12: Optimize Retention Strategy
Model your optimal deductible levels using 5-year loss history. Consider parametric coverage for CAT exposure.
- Ongoing: Establish Quarterly TCOR Reviews
Create board-ready dashboards showing TCOR trends, loss ratios, prevention ROI, and market conditions.
The Human Factor: Leadership Under Pressure
Behind every TCOR optimization success is a risk executive navigating extraordinary pressure. You're managing board expectations for cost reduction while premiums spike. You're protecting residents while carriers add exclusions. You're modernizing systems while running lean teams.
- Building coalitions: Aligning operations, finance, and asset management around TCOR metrics
- Speaking the language of value: Translating insurance complexity into NOI impact
- Investing in prevention: Proving ROI through pilot programs before scaling
- Leveraging data: Moving from anecdotes to analytics in board presentations
- Managing up and down: Communicating strategy to boards while driving adoption at properties
References
- National Multifamily Housing Council (NMHC). State of Multifamily Risk Survey & Report. 2024.
- Federal Reserve Bank of Minneapolis. "Rising property insurance costs stress multifamily housing." March 4, 2025.
- APTA. TCOR Overview. December 2023.
- The Baldwin Group. "Understanding Total Cost of Risk." July 17, 2025.
- Yardi Matrix. Property Insurance Expense Bulletin. March 2024.
- Freddie Mac. Capitalization Rate Guidance. (Value = NOI ÷ Cap Rate)
- Apartment List. National Rent Report. Current series.
- Fannie Mae. Multifamily Economic & Market Commentary. May 2024.
Notes: Visuals are schematic and scaled to the cited figures where applicable. All data sourced from published industry reports.